In the world of technical analysis, patterns play a crucial role in predicting future price movements in the financial markets. One such pattern that often captures the attention of traders and investors is the bear flag pattern. The bear flag pattern is a continuation pattern that typically signals a potential downward trend in an asset’s price. Recently, there has been speculation within the trading community that the S&P 500 may be forming a bear flag pattern. In this article, we will delve deeper into the characteristics of the bear flag pattern, examine the current market conditions of the S&P 500, and analyze the implications for traders and investors.
## Understanding the Bear Flag Pattern
Before delving into the potential formation of a bear flag pattern in the S&P 500, it is essential to understand the characteristics of this pattern. A bear flag pattern is formed after a significant downward price movement, known as the flagpole, followed by a period of consolidation in the form of a flag. The flag is characterized by a downward-sloping channel, typically representing a temporary pause or hesitation in the market before a potential continuation of the downtrend.
Traders often look for certain criteria to confirm the validity of a bear flag pattern, such as declining trading volume during the flag formation, clear support and resistance levels within the channel, and a decisive breakout to the downside following the pattern completion. It’s important to note that not all flag patterns lead to bearish outcomes, and traders should exercise caution and consider other technical indicators and market factors before making trading decisions based solely on the presence of a bear flag pattern.
## Analysis of the S&P 500
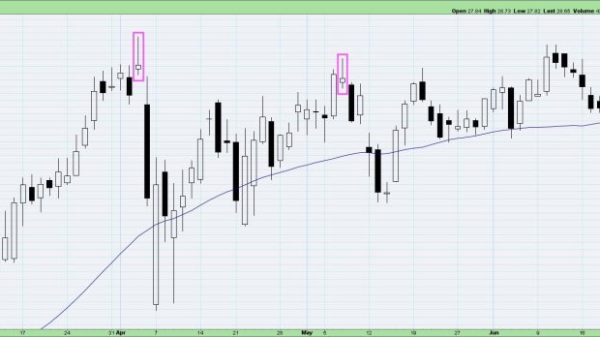
Turning our attention to the S&P 500, a widely followed benchmark index that tracks the performance of 500 large-cap U.S. stocks, there have been growing concerns among traders about the potential formation of a bear flag pattern. The index recently experienced a sharp decline, forming what appears to be a flagpole, followed by a period of consolidation within a downward-sloping channel.
During this consolidation phase, trading volume has shown signs of decrease, indicating a potential lack of conviction among market participants. Furthermore, key support and resistance levels have emerged within the flag pattern, providing traders with reference points to monitor for a potential breakout. The proximity of the index to its all-time highs adds an additional layer of significance to the current technical setup, as a decisive downside break could signal a shift in market sentiment towards a bearish bias.
## Implications for Traders and Investors
For traders and investors actively monitoring the S&P 500 and considering the potential formation of a bear flag pattern, it is essential to exercise caution and implement risk management strategies to navigate the uncertainty in the market. If the bear flag pattern confirms with a downside breakout, traders may consider implementing short positions or employing bearish strategies to capitalize on the anticipated downward price movement.
On the other hand, if the bear flag pattern fails to materialize, and the index displays signs of strength and resilience, traders should be prepared to adapt their strategies and consider bullish opportunities in alignment with the evolving market dynamics. Utilizing a combination of technical analysis, fundamental research, and market sentiment analysis can help traders gain a comprehensive understanding of the S&P 500’s current outlook and make informed decisions in line with their risk tolerance and investment objectives.
In conclusion, the potential formation of a bear flag pattern in the S&P 500 has captured the attention of traders and investors seeking insights into the market’s future direction. By understanding the characteristics of the bear flag pattern, analyzing the current market conditions of the S&P 500, and considering the implications for trading and investment strategies, market participants can navigate the challenges and opportunities presented by pattern-based analysis while staying attuned to the broader trends shaping the financial markets.


