In the world of trading, there are various technical indicators that traders use to make strategic decisions. One often-used indicator is the Relative Strength Index (RSI), a momentum oscillator that measures the speed and change of price movements. Traders utilize the RSI to identify overbought or oversold conditions in the market, which can signal potential buying or selling opportunities.
One of my favorite RSI signals is the RSI divergence. RSI divergence occurs when the price of an asset moves in the opposite direction of the RSI indicator. This can be a powerful signal to traders as it suggests a potential reversal in the current trend. For example, if the price of an asset is making higher highs, but the RSI is making lower highs, it indicates a bearish divergence, signaling a possible trend reversal to the downside.
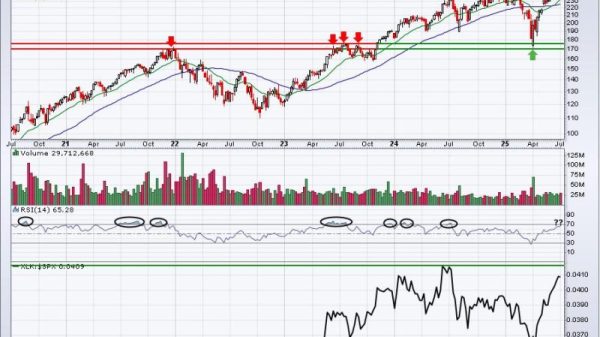
Another RSI signal that I find valuable is the RSI overbought and oversold conditions. When the RSI surpasses the 70 level, it is considered overbought, indicating that the asset may be due for a correction or a pullback. Conversely, when the RSI drops below the 30 level, it is deemed oversold, suggesting that the asset may be undervalued and primed for a potential bounce.
Moreover, the RSI can also be used to confirm trends identified through other technical analysis tools such as moving averages or trendlines. When the RSI confirms a trend, it adds further conviction to the trader’s analysis and strengthens the potential trading opportunity.
Additionally, I pay close attention to RSI crossovers, where the RSI line crosses above or below certain thresholds, such as the 50 level. A bullish crossover, where the RSI crosses above 50, can indicate a shift in momentum to the upside. Conversely, a bearish crossover, where the RSI crosses below 50, can signal a potential shift in momentum to the downside.
In conclusion, the Relative Strength Index is a versatile and powerful tool that can provide valuable insights to traders when used in conjunction with other technical indicators. By understanding and recognizing different RSI signals such as divergences, overbought/oversold conditions, trend confirmations, and crossovers, traders can enhance their analysis and make more informed trading decisions. It is essential for traders to test and refine their strategies using RSI signals in different market conditions to maximize their trading success.


