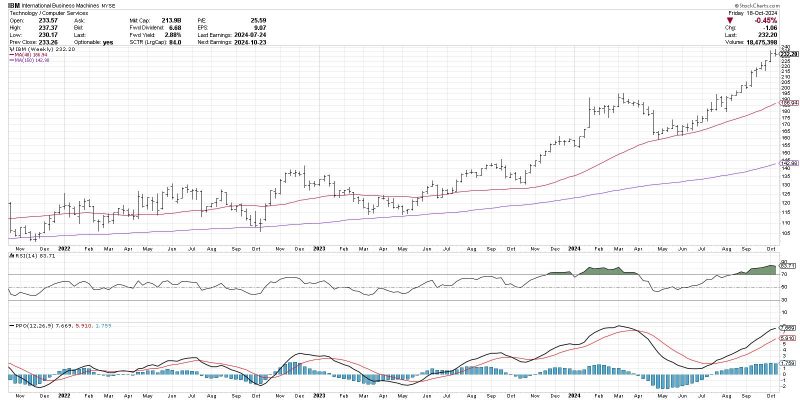
The Moving Average Convergence Divergence (MACD) histogram is a powerful technical indicator that traders use to anticipate trend changes in the financial markets. By examining the relationship between two moving averages, the MACD histogram provides valuable insights into the strength and direction of a trend. Traders can use this indicator to identify potential turning points in the market and make informed trading decisions.
One of the key features of the MACD histogram is its ability to reveal the momentum of a trend. The histogram plots the difference between the MACD line and the signal line, allowing traders to see when momentum is increasing or decreasing. A rising histogram indicates that bullish momentum is strengthening, while a falling histogram suggests that bearish momentum is gaining traction. By monitoring changes in the histogram, traders can anticipate when a trend is likely to reverse.
Another important aspect of the MACD histogram is its ability to signal potential trend changes. When the histogram crosses above the zero line, it indicates a shift from bearish to bullish momentum, suggesting that a new uptrend may be emerging. Conversely, when the histogram crosses below the zero line, it signifies a transition from bullish to bearish momentum, signaling the start of a potential downtrend. By paying attention to these crossovers, traders can identify trend reversals early on and position themselves accordingly.
In addition to detecting trend changes, the MACD histogram can also help traders confirm the strength of a trend. When the histogram diverges from the price action, it suggests that the current trend may be losing momentum and is vulnerable to a reversal. Conversely, when the histogram moves in the same direction as the price, it validates the strength of the trend and increases the likelihood of its continuation. By using the MACD histogram in conjunction with other technical indicators, traders can gain a more comprehensive understanding of the market dynamics and make more accurate predictions about future price movements.
Overall, the MACD histogram is a valuable tool for anticipating trend changes in the financial markets. Its unique ability to gauge momentum, signal trend reversals, and confirm trend strength makes it an indispensable resource for traders looking to stay ahead of the curve. By incorporating the MACD histogram into their trading strategy, traders can enhance their decision-making process and improve their overall trading performance.


