Market Sentiment Indicators: A Comprehensive Guide
Market sentiment indicators play a crucial role in analyzing the behavior of investors and traders in financial markets. By understanding the prevailing sentiment, traders can gauge the potential direction of the market and make more informed decisions. In this article, we will delve into three major market sentiment indicators that confirm a bearish phase in the market.
1. Fear and Greed Index:
The Fear and Greed Index is a popular sentiment indicator that measures both investor fear and greed levels. This index ranges from 0 to 100, with extreme fear at 0 and extreme greed at 100. During periods of extreme fear, investors tend to sell off assets and move to safer investments, causing market downturns. Conversely, extreme greed indicates investors are overly optimistic, which may lead to market bubbles and subsequent corrections. A reading below 50 indicates fear in the market, while a reading above 50 suggests greed. A consistent low reading on the Fear and Greed Index can signal a bearish phase in the market.
2. Put/Call Ratio:
The Put/Call Ratio measures the trading volume of put options to call options in a given market. Put options give investors the right to sell an asset at a specified price, while call options give the right to buy. A high Put/Call Ratio indicates that investors are buying more put options to protect against potential market declines, reflecting a bearish sentiment. Conversely, a low Put/Call Ratio suggests bullish sentiment as investors are more inclined to buy call options in anticipation of market gains. Monitoring changes in the Put/Call Ratio can provide valuable insights into the prevailing market sentiment and potential market reversals.
3. VIX Volatility Index:
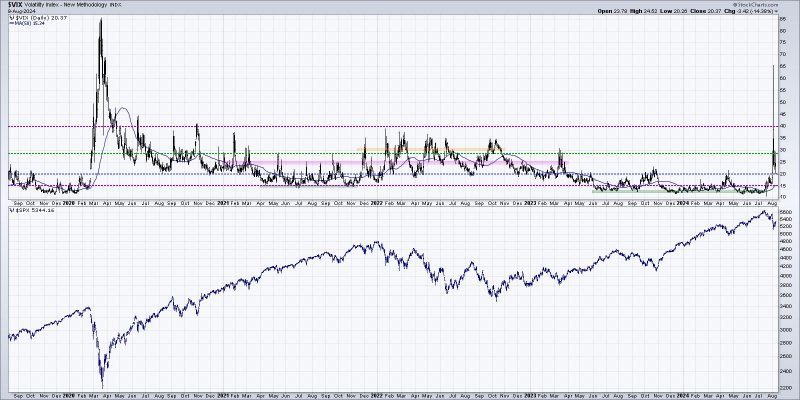
The VIX Volatility Index, also known as the fear index, measures the market’s expected volatility over the next 30 days. When the VIX is low, it indicates low expected volatility and complacency in the market, signaling a bullish sentiment. Conversely, a high VIX reading suggests heightened volatility and fear among investors, pointing towards a bearish sentiment. Sharp increases in the VIX often coincide with market downturns, as heightened volatility is typically associated with market declines. By tracking the VIX Volatility Index, traders can assess market sentiment and prepare for potential shifts in market direction.
In conclusion, market sentiment indicators provide valuable insights into the collective psychology of investors and traders, helping to identify potential market trends and reversals. By analyzing indicators such as the Fear and Greed Index, Put/Call Ratio, and VIX Volatility Index, traders can better navigate volatile market conditions and make informed trading decisions. Understanding market sentiment is a key aspect of successful trading and can help traders anticipate market movements before they occur. As always, it is essential to use multiple indicators in conjunction with thorough analysis to form a comprehensive view of market sentiment and make well-informed investment decisions.


