Breadth indicators are essential tools in gauging the overall health and strength of a market trend. They provide valuable insights into the breadth of participation across various stocks or securities, helping traders and investors confirm whether a bullish market trend is sustainable. In this article, we will delve into three key breadth indicators that can effectively confirm a bullish market trend when analyzed together.
1. Advance-Decline Line (A/D Line):
The Advance-Decline Line is a popular breadth indicator that measures the number of advancing stocks versus declining stocks in a given market. By tracking the cumulative difference between these two groups over time, the A/D Line offers a broader perspective on market performance beyond just the major indices. In a bullish market trend, the A/D Line tends to trend higher, signaling widespread strength across a wide range of stocks. A consistently rising A/D Line suggests that the majority of stocks are participating in the uptrend, reinforcing the bullish thesis.
2. New Highs-New Lows Index:
The New Highs-New Lows Index compares the number of new 52-week highs to new 52-week lows in a market or index. A strong bullish trend is typically characterized by a higher number of new highs compared to new lows, indicating that a significant number of stocks are making new highs and exhibiting strength. Conversely, a widening gap between new highs and new lows signals a lack of breadth and underlying weakness in the market, potentially hinting at a reversal or corrective phase. By monitoring the New Highs-New Lows Index, traders can assess the overall breadth of the market trend and confirm the sustainability of a bullish move.
3. Percentage of Stocks Above Moving Averages:
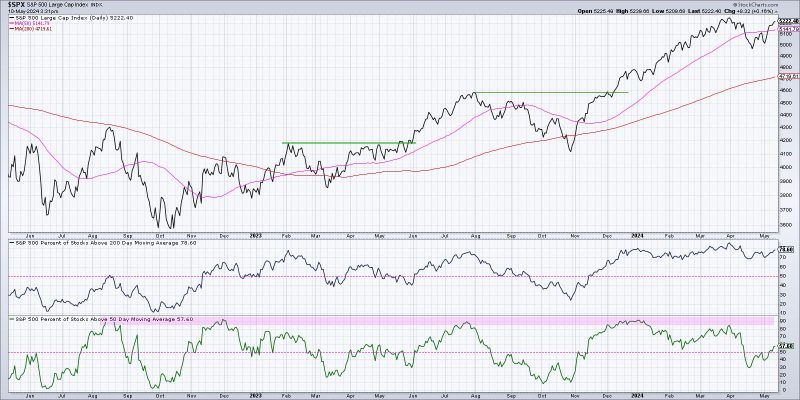
This breadth indicator measures the percentage of stocks trading above key moving averages, such as the 50-day or 200-day moving average. In a strong bullish market, a higher percentage of stocks trading above their moving averages indicates broad participation and momentum. When a large number of stocks are above their moving averages, it suggests that the market trend is well-supported and likely to continue its upward trajectory. Conversely, a declining percentage of stocks above moving averages may signal waning strength and divergence among various stocks, potentially foreshadowing a trend reversal or consolidation phase.
In conclusion, analyzing breadth indicators is crucial for confirming a bullish market trend and identifying potential opportunities in the market. By paying attention to key breadth indicators such as the Advance-Decline Line, New Highs-New Lows Index, and Percentage of Stocks Above Moving Averages, traders and investors can gain a comprehensive view of market participation and underlying strength. Incorporating these breadth indicators into your analysis can help you make informed decisions and navigate the market with confidence.

